While I was accruing the typing speed data each time I practiced on Typractice, the user was not able to see it. They had no way of knowing how they have progressed (or regressed) over time.
I started by wanting to add a table where each entry will be shown but instead went ahead with a chart because it looks fancier, and also it makes it easier for the user to see the trend.
Looked around a bit for a charting library and decided to go with the Chart.js library which has sane defaults with options to customize a lot of things.
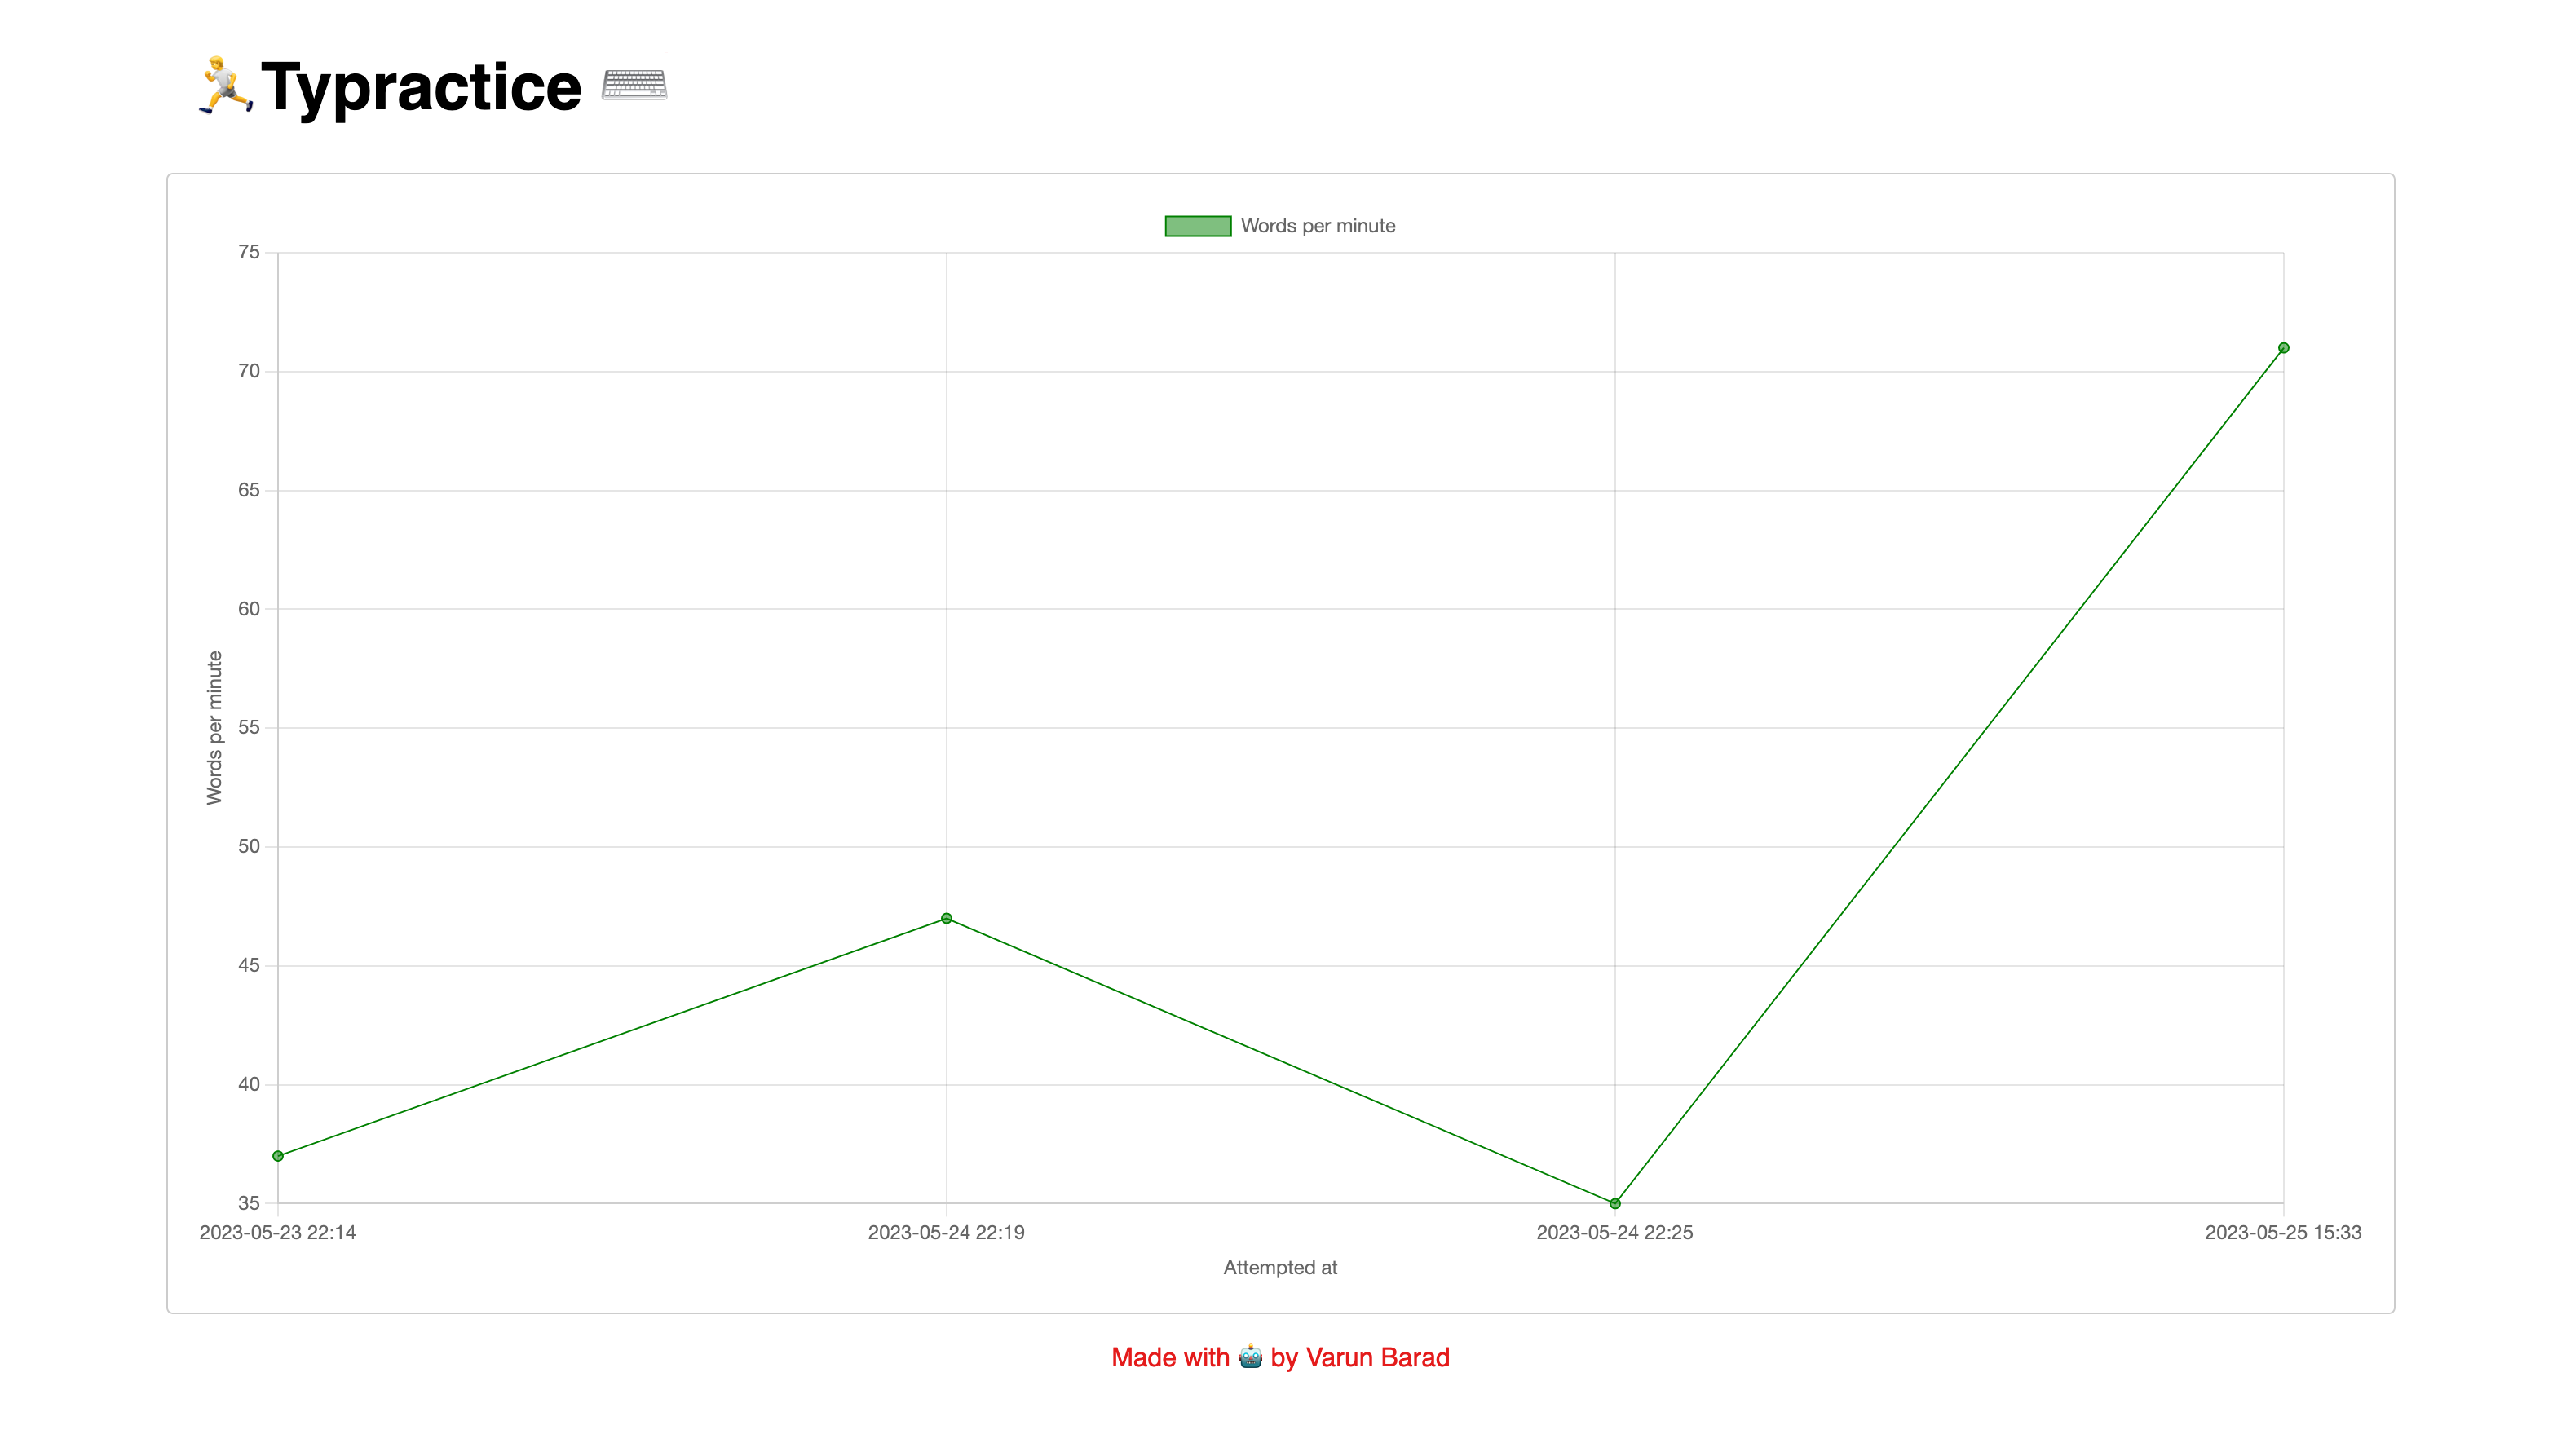
Each entry in the line-chart represents the speed (in words-per-minute) and the timestamp of the attempt. You can also hover over each point to see the exact value.
Would love to see how your speed has changed over time. Send me screenshots of your charts.
Articles on this project
- Public release
- Adding stats chart (this article)
- Adding summary stats table